Marblehead - Halifax Race.

If you have haven't done the Marblehead to Halifax Ocean Race (MHOR) it is well
worth considering. Begun in 1905 and formalized as a biennial race in 1939, the
MHOR has become a very popular event. It is a challenging race
and also offers easy access to Nova Scotia, Cape Breton and Maine - some of the
best cruising around. Check out the official
MHOR site for more details.
Weather routing analysis is most useful for this race when there are variable wind conditions. If the wind is strong and steady then simply sailing the rhumb line is often the best choice. Of the seven races I've done, I've only been able to sail the rhumb line twice. There are 3 key decisions to make:
-
What's the best course from Marblehead to the vicinity of Brazil Rock?
-
At Brazil Rock is it best to sail close to land or go wide and stay further offshore?
-
What's the best course for the last leg to Halifax?
The Basics
SailFast uses an
"isochron" methodology to find the fastest route between any two points. An
isochron is simply a locus of points showing where a boat can be at a certain
time after the start. Wind and current forecasts plus boat polars are used to determine boat speed and position for all possible routings. The Wind forecast is usually the primary factor that determines the optimum route. However current can have a meaningful impact when wind is relatively light and currents are significant. Prior to version 10, SailFast incorporated tidal currents for the Gulf of Maine based on the Atlas of Tidal Currents, Bay of Fundy & Gulf of Maine, published by the Canadian Hydrographic Service (CHS). As of SalFast version 10, surface current forecasts from NOAA's Gulf of Maine Ocean Forecast System (GOMOFS) are used instead. GOMOFS is based on a modern hydrodynamic model with much higher resolution and accuracy. The model's digital data output is not directly compatible with routing software, but first needs to be suitably converted. Refer to our GOMOFS App Note for a more complete description of the available
GOMOFS forecasts and SailFast's unique access to the model
data.
Farr 40 Example
We are using a Farr 40 in these routing examples. Other boats may yield significantly different optimum routings. The wind forecast is NOAA's GFS model computed at 6AM July 1, 2019, a week prior to the actual race start. Our simulated start time is July 1 at 1 PM. Obviously the wind forecast and optimum weather routing at the actual July 7th start will not be the same. The GOMOFS current forecast was also computed at 6 AM July 1, with hourly forecasts out to 3 days. Grid size is 0.05 degrees, or about 3 NM. This is a very large file but it can be downloaded prior to race start when there is access to high speed Wi-Fi.
Figure 1 shows the fastest route from start to finish, taking 66.4 hours. The isochron lines show possible boat positions every hour. Lines that are close together indicate low boat speed due primarily to light wind strength. Boundary lines (dashed magenta lines) constrain the allowed sailing area. Since this routing hits the lower boundary near 68 W 42 N the boundary could be extended to see if a faster route results.
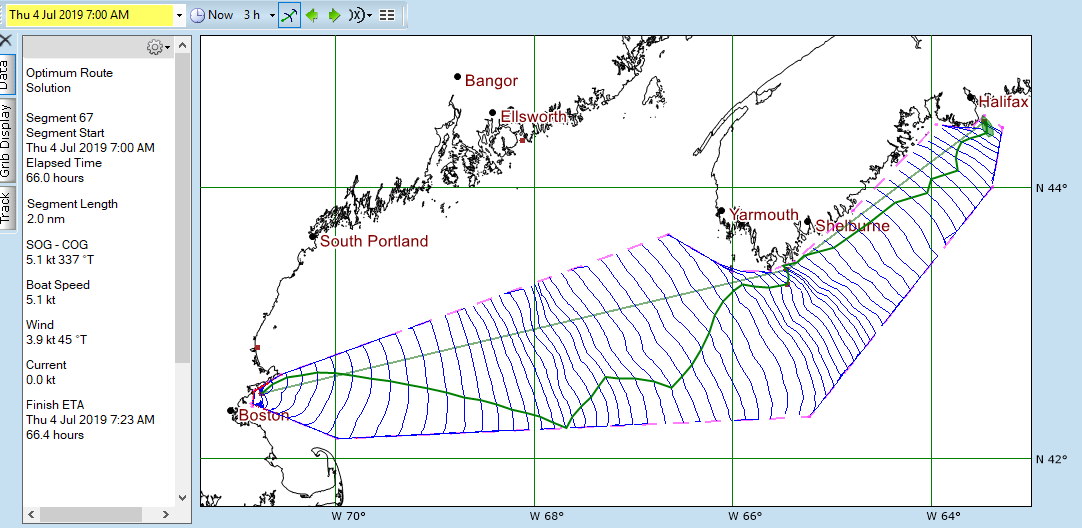
Figure 1. Optimum Route, 66.4 Hours
With Wind and mean sea level pressure added to Figure 2, we see why the leg 1 routing goes so far below the rhumb line. At 18 hours into the race there is a Low sitting on the rhumb line and a large region with wind under 1 knot. By 26 hours elapsed time the wind fills back in and the Farr 40 is able to sail back towards Brazil Rock.
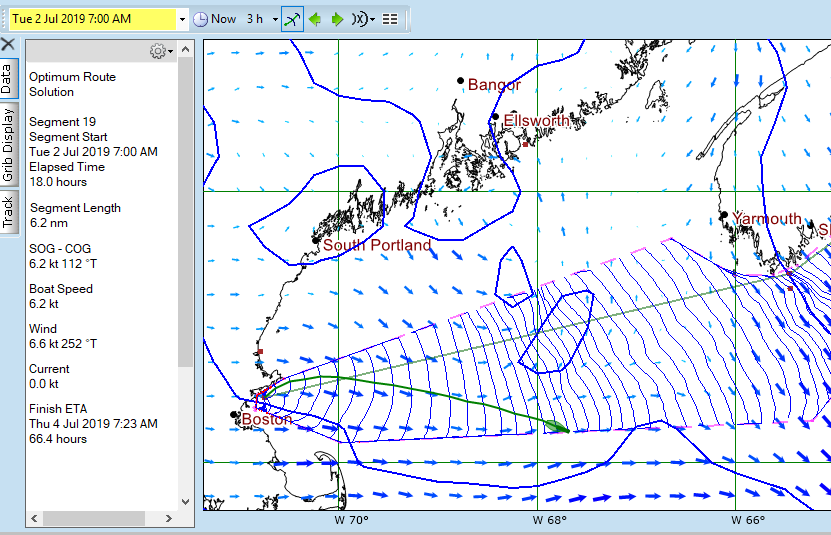
Figure 2. Optimum Route, First Leg Low Pressure & Light Wind
A useful "what-if" scenario is to consider what the routing would be if we don't sail so far below the rhumb line.
In Figure 3 we have added a short vertical boundary which forces the routing solution to be above the line. Total race time is now 67 hours, only 0.6 hours slower than the optimum. You might trade off some elapsed time for remaining closer to the rhumb, reducing the risks of unfavorable wind shifts. I'd also explore other boundary constraints & routing possibilities.
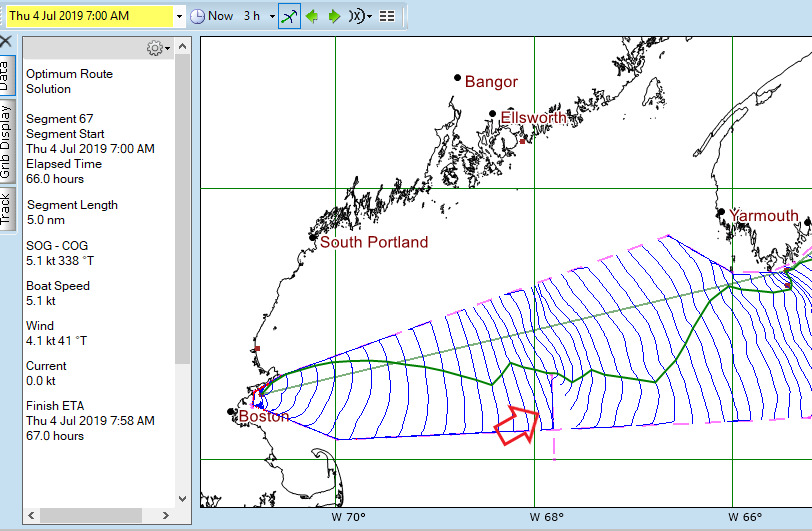
Figure 3. Routing With Added Lower Boundary Line, 67 Hours
Let's return to the original optimum route and the approach to Brazil Rock.
Figure 4 shows boat position at 37 hours elapsed, with current arrows displayed. Looking at the data in the left side pane we see that the wind is only 3.5 knots with a favorable current of 3.1 knots. This yields a speed through the water of 5 knots and a speed over ground (SOG) of 7.8 knots. So by sailing close to land we have picked up a very favorable boost from the current. A few hours later the current has reversed but the Farr 40 has moved beyond the strongest flow so the adverse effect is a lot less. At this point I'd try scenarios with boundaries that force the route farther offshore so I could evaluate the tradeoffs.
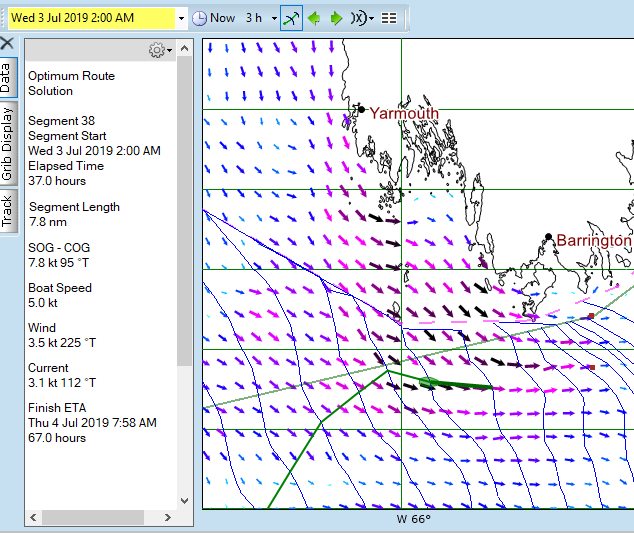
Figure 4. Approach To Brazil Rock
The route for the final leg in this example is not significantly affected by changing boundary lines and forcing the route closer to the rhumb line. At worst case the total elapsed time was increased by 0.2 hours. Often the main motivation for sailing offshore on this leg is to avoid the reduced wind speed near shore that may result from land effects. SailFast can help you gauge exactly how far South of the rhumb line you want to be. It's always best to have an updated wind forecast available when nearing the final leg since the forecast downloaded at the start may be significantly in error by now.
Once you have one or more routings you want to use, save and refer to the Optimum Routing Table (Figure 5). The table shows critical information for every segment of the route. In this case for every hour of the race.
-
Compare wind forecast to actual observed wind to judge forecast accuracy.
-
Plan ahead for sail changes and selection.
-
Steer and trim to obtain target boat speed.
-
Impress your crew by predicting major wind shifts.
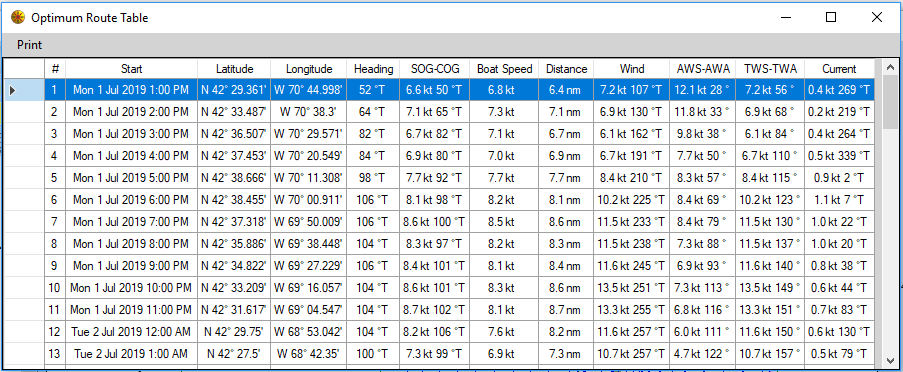
Figure 5. Optimum Route Table